 https://greenmarked.it/wp-content/uploads/2023/11/photo_2023-11-02_16-27-06.jpg
853
1280
Etienne Hoekstra
https://greenmarked.it/wp-content/uploads/2022/01/LOGO-GREENMARKED-SITO-600x600.png
Etienne Hoekstra2023-11-02 22:41:252024-05-16 10:22:27Dutch Cities to Hit 50 Degrees?
https://greenmarked.it/wp-content/uploads/2023/11/photo_2023-11-02_16-27-06.jpg
853
1280
Etienne Hoekstra
https://greenmarked.it/wp-content/uploads/2022/01/LOGO-GREENMARKED-SITO-600x600.png
Etienne Hoekstra2023-11-02 22:41:252024-05-16 10:22:27Dutch Cities to Hit 50 Degrees?August 01, 2023
The National Climate Change Adaptation Strategy has been adopted in Italy since 2015 [1]. And already in the Strategy documents, scientific knowledge about the Country’s impacts and vulnerabilities to climate change are outlined with evident clarity and an analysis of the relevant national and EU regulations on the subject.
The Plan of the same name, currently undergoing Strategic Environmental Assessment (SEA), aims to implement the Strategy in order to provide a guiding tool for planning more effective adaptation actions for Italian territory [2]. However, the critical issues and shortcomings of the Plan appear to be numerous, particularly regarding the real effectiveness, pragmatism and feasibility of the proposed actions [3].
But let us go in order. The conceptual innovativeness of the Plan (and even before, of the Strategy) is evident right from the title. Traditionally – to be clear, at the time of the Earth Summit (1992) [4] – the fight against climate change sees only one action: mitigation. And indeed, by the early 1990s, the consideration is not incorrect. And nothing else mitigation provides for what precisely we have been trying to implement for the past 30 years: reduction of anthropogenic greenhouse gas emissions, that is, actions aimed at combating the very causes of climate change, which are clearly man-made. Instead, the novelty present in the Plan and Strategy sees the introduction of the concept of adaptation, which – from my personal naturalistic-forestry perspective – I certainly like.
Adaptation
Adaptation involves – just as animals and plants themselves do in nature – the realization that climate change is happening, exists, and persists. If it is not possible to undo them or at least reduce their triggers through mitigation actions, it is necessary to cope with them by adapting to them, in a world that is certainly different (and warmer, trivializing) but still livable.
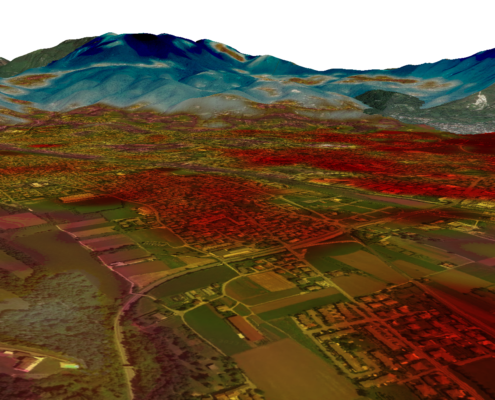
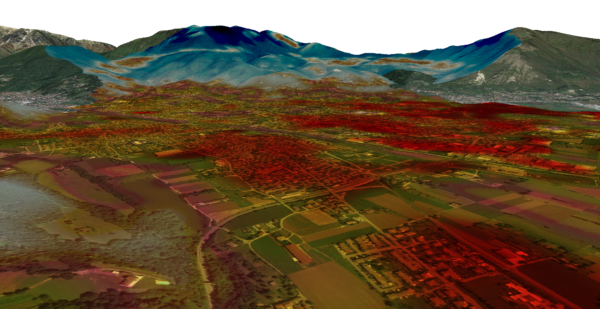
Let’s start with a simple yet effective example. The images in Figure 1 refer to the territory of the Municipality of Schio (Vicenza, Italy) and show the land use (on the left) and the corresponding Land Surface Temperature (LST, on the right) measured on August 04, 2022, by the Landsat 9 Satellite. A detailed image of the territory of Schio, colored by LST value, can also be seen in the cover image.
There is no doubt that for the areas of the territory occupied by man-made surfaces (industrial, residential, commercial areas: in grey and yellow on the map) the LST is clearly higher. On the contrary, the forested and grassland areas (in green) show lower temperatures, with a maximum of even 20 °C difference measured between the mountainous forested areas in the northwest in comparison with the industrial area in the east of the territory. A quick analysis of the data reveals the following average LST values by land use category:
⦁ Urban areas: 24.8 °C;
⦁ Agricultural areas: 23.0 °C;
⦁ Forests: 19.2 °C;
⦁ Rivers: 24.5 °C.
Even taking into account a significant altitudinal difference between urban areas (predominantly developed in the valley) and forests (prevalent in the hilly and mountainous areas), the differences in terms of temperature are evident.
In addition, when analyzing the average temperature for urban green areas alone, a value of 24.3 °C emerges, which, albeit minimally, is lower than the average value for entire urban areas.
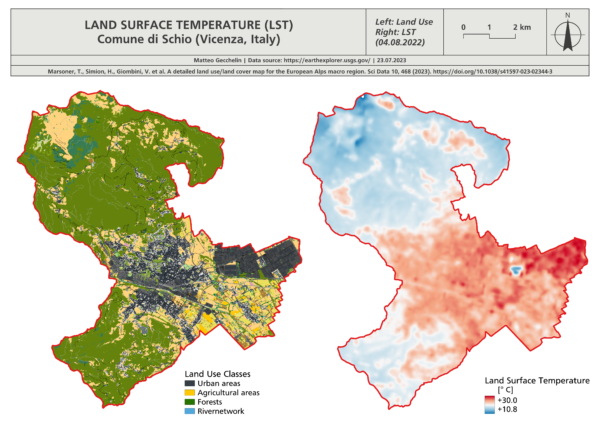
Fig. 1: Land Surface Temperature (LST) and Land Use Map, Municipality of Schio (Vicenza, Italy). Author.
These urban green areas perfectly represent the concept of adaptation. It may seem trite to state it, and, unquestionably, we are all aware of it, but where there is greenery, especially in the city, measured and perceived temperatures are also lower than in otherwise man-made areas. And indeed, such a concept of “green adaptation” also emerges among the strategies proposed by the Plan under the name of “nature-based solutions.” And yet, as already remarked [3], such green strategies seem lacking and underestimated in the Italian context, although strongly encouraged and recommended by European strategies [5].
Among the latter, are at least to be cited the so-called “integrated solutions” involving the development of spatial connectivity by means of green infrastructure (two plus points: ecological connectivity for animal and plant species and climate change adaptation measure) and all other solutions based on ecosystem services (forestry and agro-forestry, river, coastal, and marine), even if not better specified.
In addition, equally noteworthy are the actions defined in the Governance macro-category, Plans and Strategy category, where the following are at least taken into consideration: (1) Protected Areas Management; (2) Fire Risk Management; (3) Forestry Planning; (4) Hydrographic District Planning; and (5) Hydrogeological Structure Plans. These are all subjects that have a very strong connection with the territory, not only in terms of urban and territorial planning, but also in terms of the development of the local economy and the safeguarding and safety of the population, and yet they are often disregarded or taken into consideration only after the occurrence of extreme and disastrous phenomena, in response always to the consequences and almost never to the triggering causes nor with a view to prevention [6]. What specifically these actions pertaining to sector planning entail is not known from the Plan. However, it is already a first step that at least these actions are remembered and mentioned as being of interest to the legislature.
Finally, it is good to remember how any strategic action to be activated on a nationwide scale cannot be separated from collaboration both among all stakeholders for the sector and among all funding and planning instruments at the national and local levels. The challenge for mitigation or, in this case, for adaptation to climate change sees us all as key players. The local scale (as demonstrated by the heatwave example for the small provincial municipality reported here) is not beyond the scope of global dynamics, and strategic directions at every level must be aware of this, giving rise to actions and incentives that are truly capable of influencing (positively) the development of effective and resilient adaptation in the face of expected adversity.
This article is part of the project “PILLOLE D’ACQUA PIANA: seminari itineranti, blog e podcast per una gestione sostenibile delle risorse idriche in Piana Rotaliana” carried out by ECONTROVERTIA APS and supported by Fondazione Caritro (Prot. no. U445.2023/SG.386 of April 23, 2023).


Related articles:
References:
[1] Ministero dell’Ambiente e della Sicurezza Energetica, “Strategia Nazionale di Adattamento ai cambiamenti climatici,” 03 August 2016. [Online]. Available: https://www.mase.gov.it/notizie/strategia-nazionale-di-adattamento-ai-cambiamenti-climatici-0
[2] Ministero dell’Ambiente e della Sicurezza Energetica, “Piano Nazionale di Adattamento ai Cambiamenti Climatici,” 11 May 2023. [Online]. Available: https://www.mase.gov.it/pagina/piano-nazionale-di-adattamento-ai-cambiamenti-climatici 2023
[3] scienzainrete.it, “Il piano nazionale di adattamento ai cambiamenti climatici: le carenze di un piano strategico per il futuro del paese,” 25 May 2023. [Online]. Available: https://www.scienzainrete.it/articolo/piano-nazionale-di-adattamento-ai-cambiamenti-climatici-le-carenze-di-piano-strategico
[4] Climate-ADAPT, “United Nations Framework Convention on Climate Change (UNFCCC),” 07 June 2016. [Online]. Available: https://climate-adapt.eea.europa.eu/en/metadata/organisations/united-nations-framework-convention-on-climate-change-unfccc?set_language=en
[5] Climate-ADAPT, “Strategia di adattamento dell’Unione europea,” 24 February 2021. [Online]. Available: https://climate-adapt.eea.europa.eu/it/eu-adaptation-policy/strategy/index_html?set_language=it
[6] M. Gecchelin, “Dalla prevenzione all’azione. Cause e conseguenze degli incendi boschivi in Italia,” GreenMarked Blog, 14 April 2022.
Cover- and preview image: The territory of the municipality of Schio (Vicenza, Italy) during a heatwave as of August 04, 2022. In red the highest temperatures, in blue the coolest temperatures. Processed from Landsat 9 Satellite data. Author: Matteo Gecchelin.


