 https://greenmarked.it/wp-content/uploads/2024/03/nareeta-martin-FoG7PKNYjpM-unsplash-scaled.jpg
1707
2560
Barbara Centis
https://greenmarked.it/wp-content/uploads/2022/01/LOGO-GREENMARKED-SITO-600x600.png
Barbara Centis2024-03-21 21:10:062024-03-22 23:07:21Waste Management: State of the Art and Future Emergencies
https://greenmarked.it/wp-content/uploads/2024/03/nareeta-martin-FoG7PKNYjpM-unsplash-scaled.jpg
1707
2560
Barbara Centis
https://greenmarked.it/wp-content/uploads/2022/01/LOGO-GREENMARKED-SITO-600x600.png
Barbara Centis2024-03-21 21:10:062024-03-22 23:07:21Waste Management: State of the Art and Future EmergenciesSeptember 15, 2023
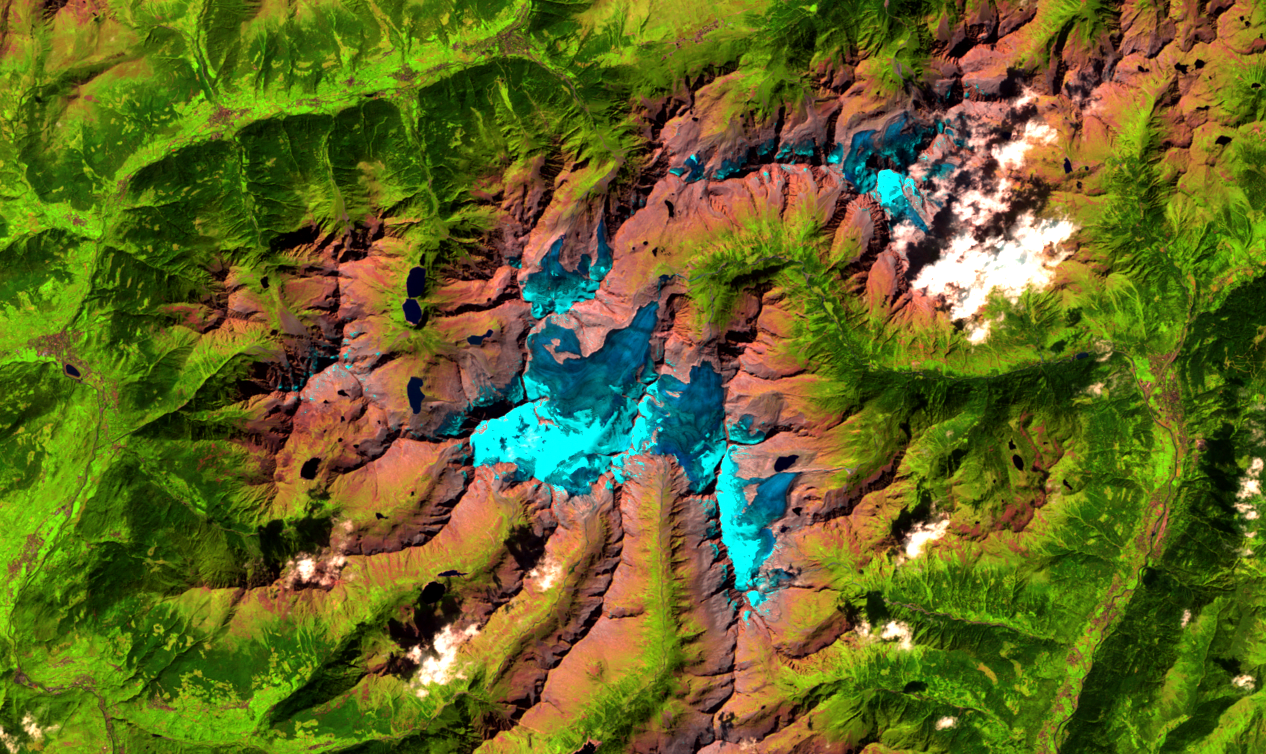
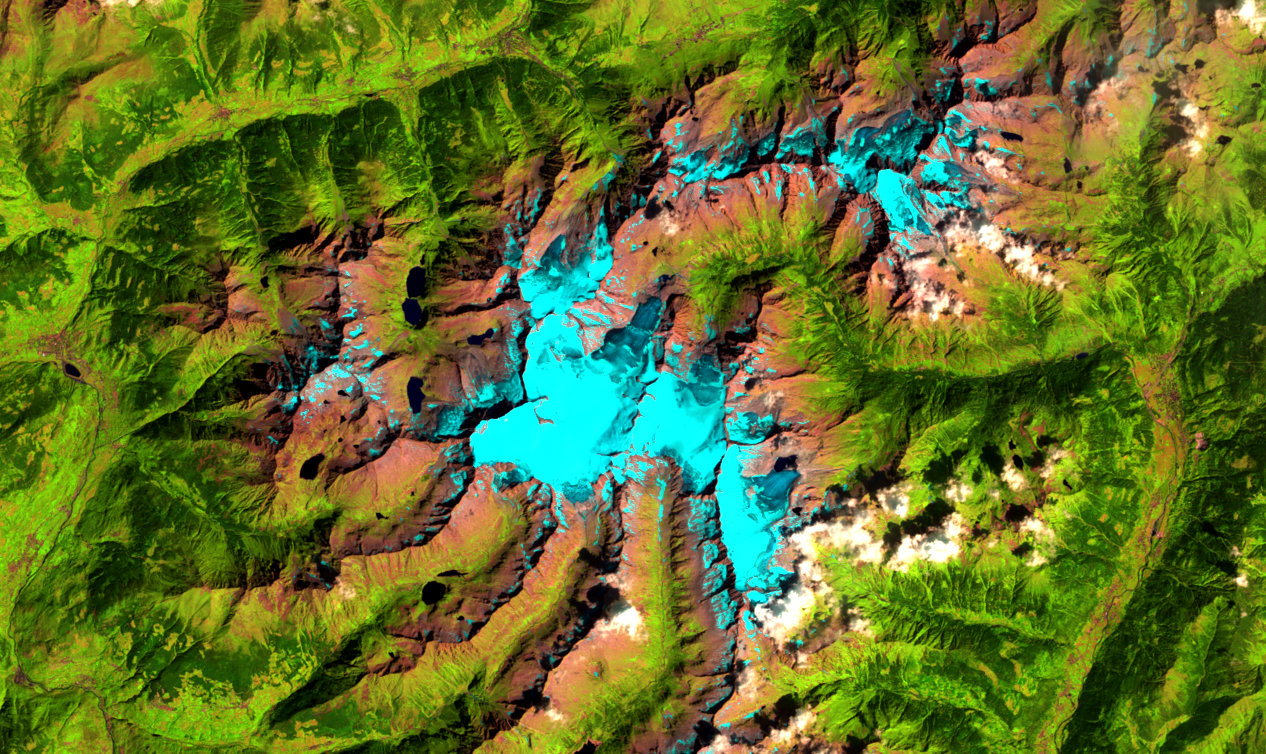
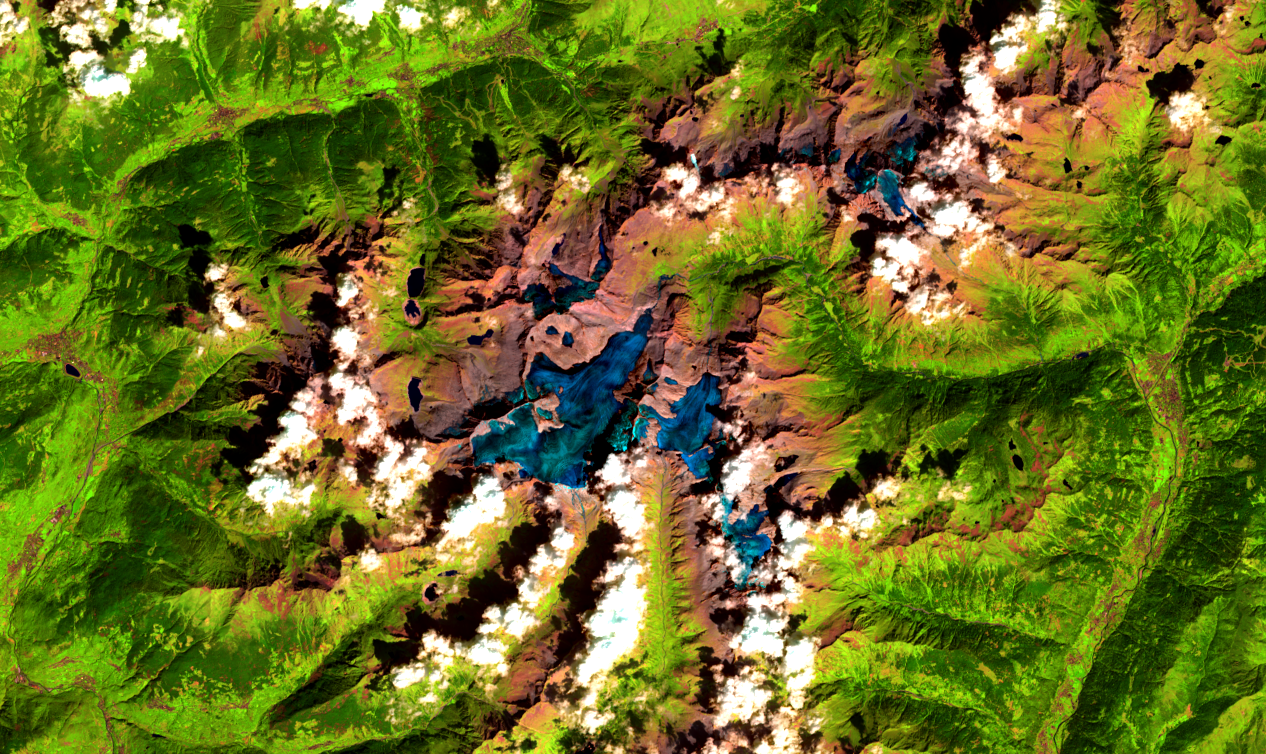
The Glacier Caravan [1], an initiative organized by the NGO Legambiente, now in its fourth edition, recently ended. With the scientific collaboration of the Italian Glaciological Committee (CGI), the caravan made a 6-stage journey to monitor the dramatic retreat of glaciers due to the climate crisis.
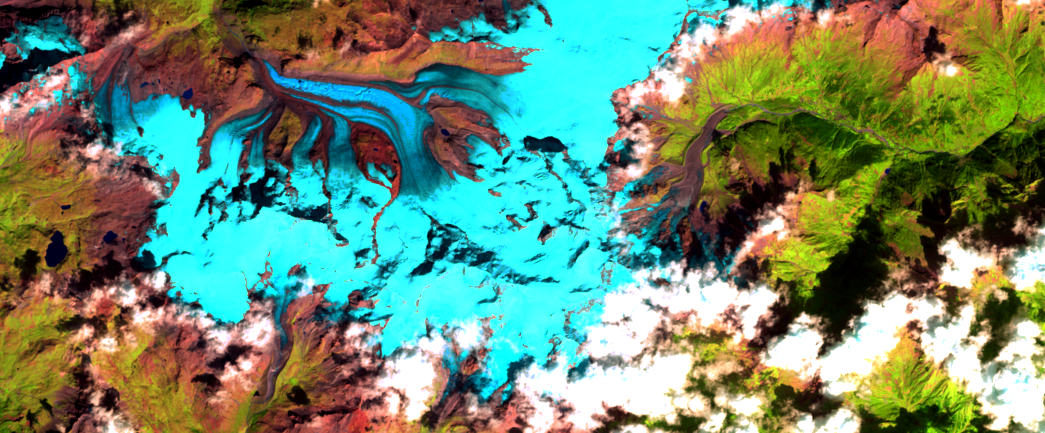
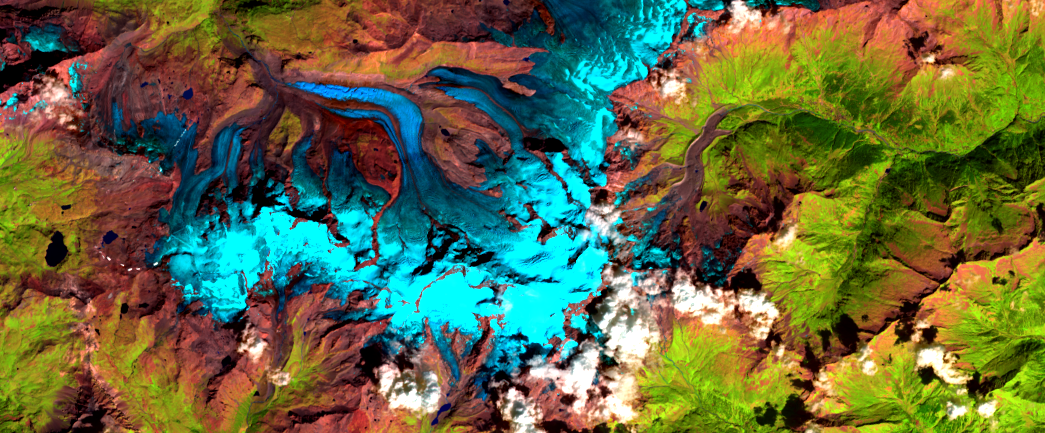
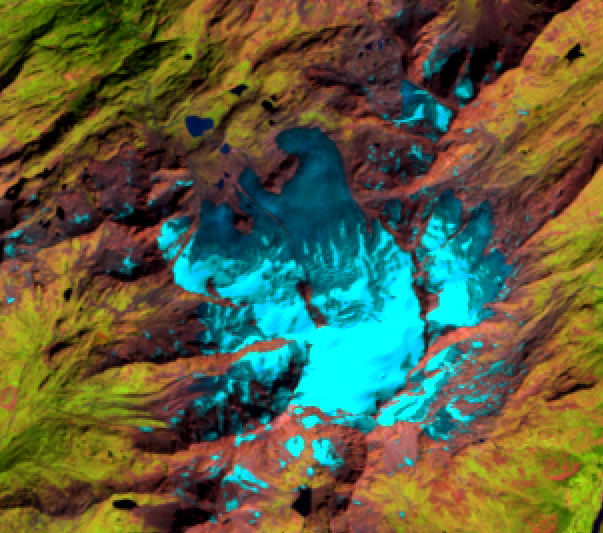
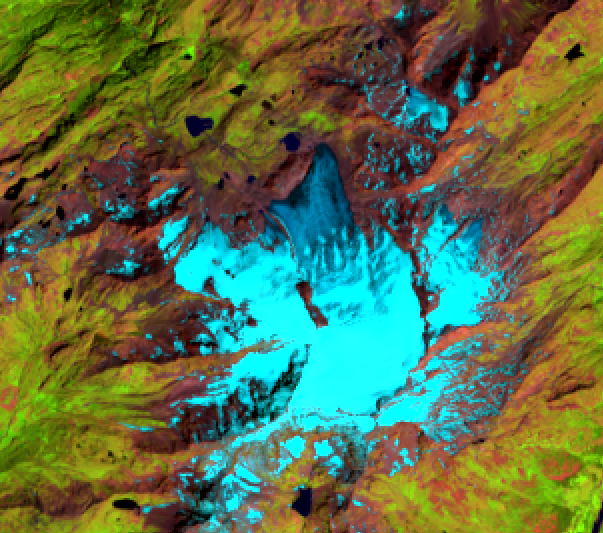
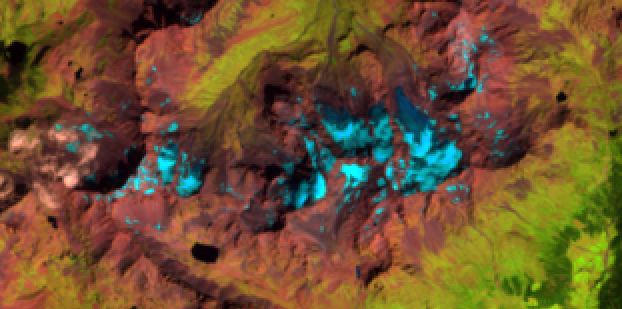
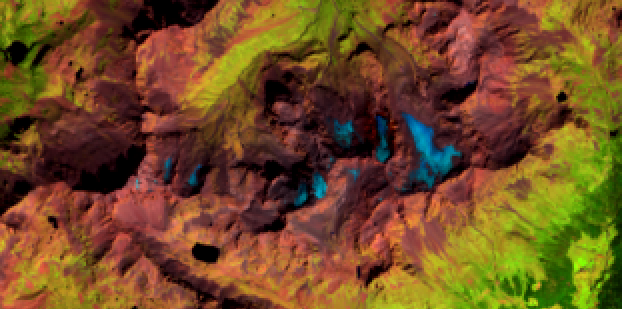
We will retrace the 6 stages through as many satellite images of each glacier, allowing everyone to see how dramatic the situation is with each passing year.
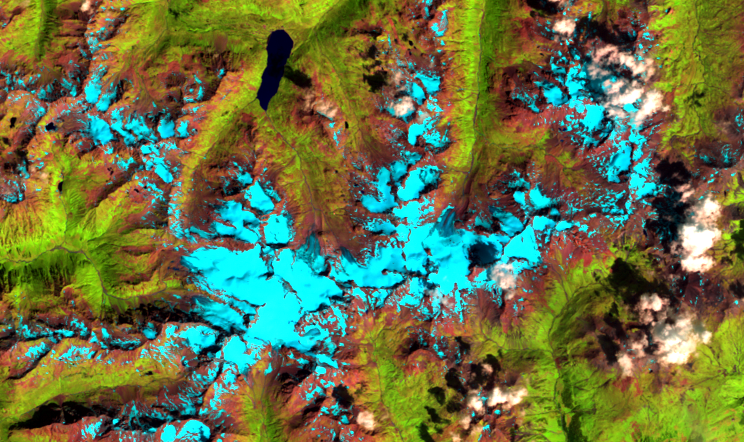
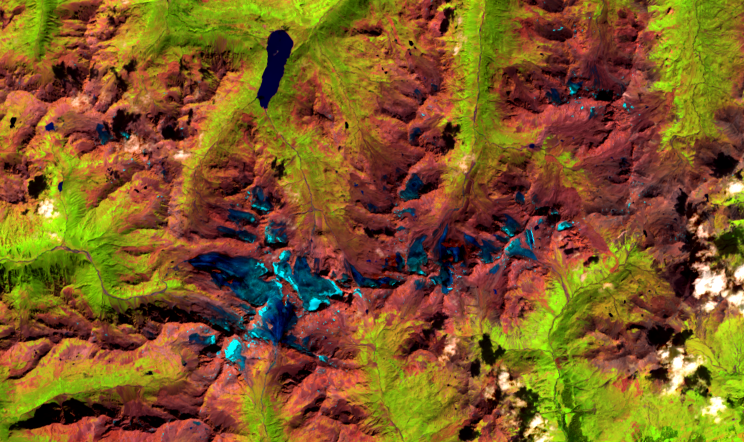
Lares and Mandrone Glaciers: 1986 – 2000 – 2023
High mountains and glaciers are very inaccessible and unstable areas, where it is best not to venture unless highly prepared and equipped. That is why nowadays much of the surveying for glacier monitoring is done remotely, thanks to satellite constellations constantly orbiting the earth.
For example, Claudia Notarnicola, director of the Institute for Earth Observation at Eurac Research, recently published a paper [2] showing that globally, snow remains on average two weeks less than in 1982. NASA MODIS data [3], which offer daily snow cover maps from February 2000, were used for this study.
Using other satellites, we could go back even further: NASA’s Landsat program has been active since the 1970s and the first satellite was launched in 1972 [4].
Moreover, thanks to new tools such as STAC (SpatioTemporal Asset Catalog) based data catalogs [5] and operators such as Microsoft offering this data for free [6], we can access satellite images from around the world quickly and efficiently.
This process of democratizing satellite data allows many new scientists to analyze and understand the environment around us, reducing the barriers to entry caused by the huge amount of imagery to manage.
Belvedere Glacier: 2000 – 2023
Ochsentaler Glacier: 2000 – 2023
Morteratsch Glacier: 2000 – 2023
Rutor Glacier: 2000 – 2023
Dosde Glacier: 2000 – 2023
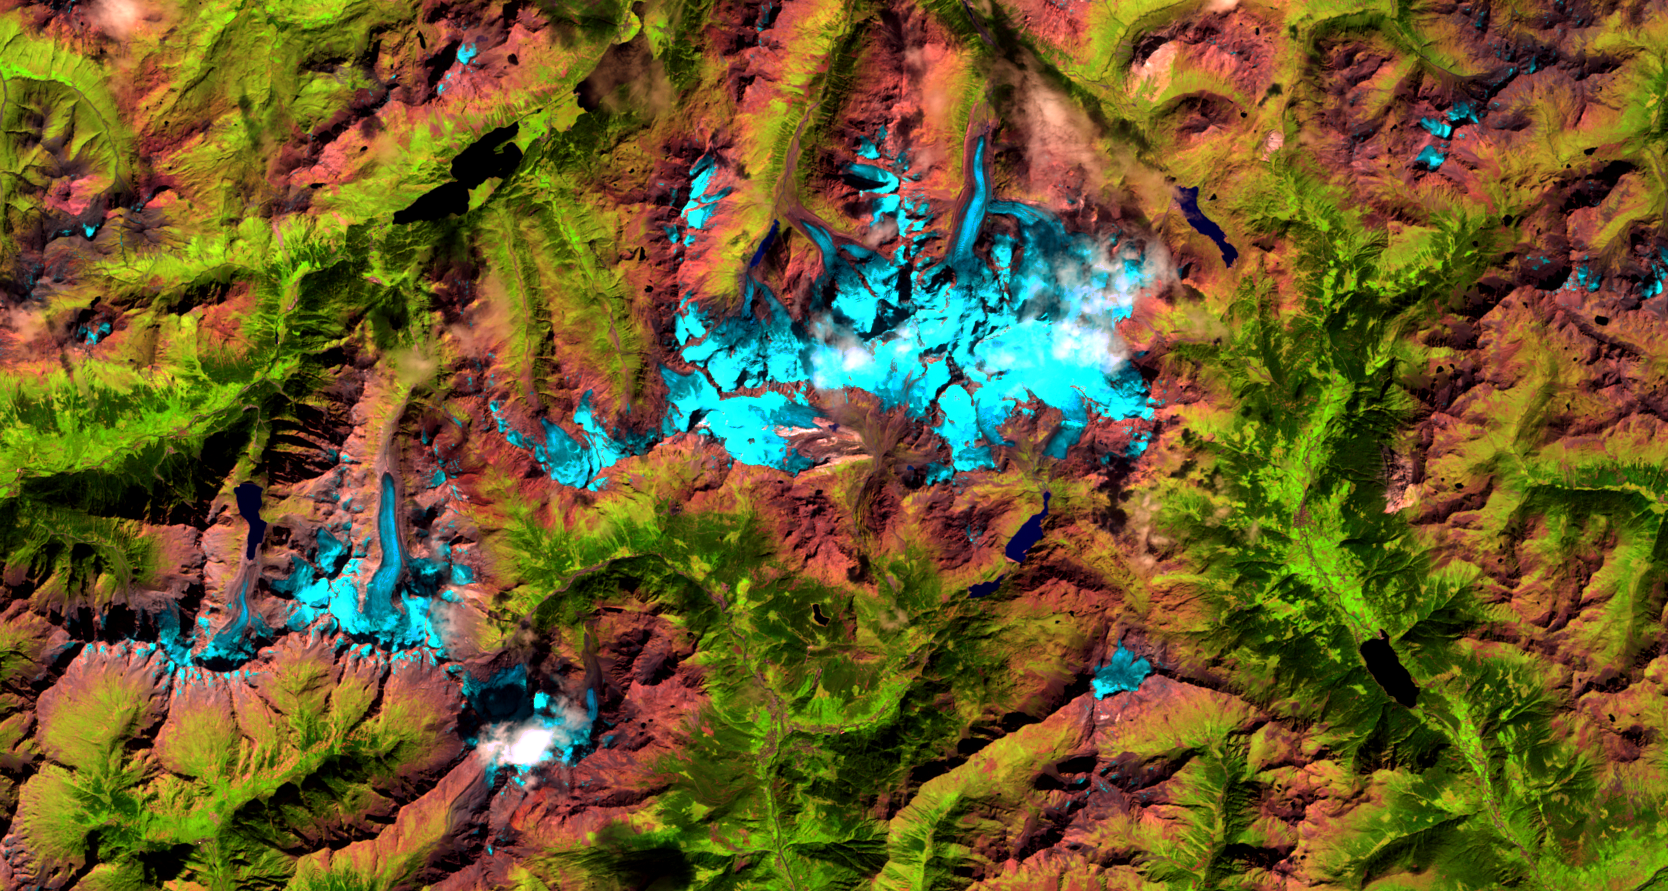
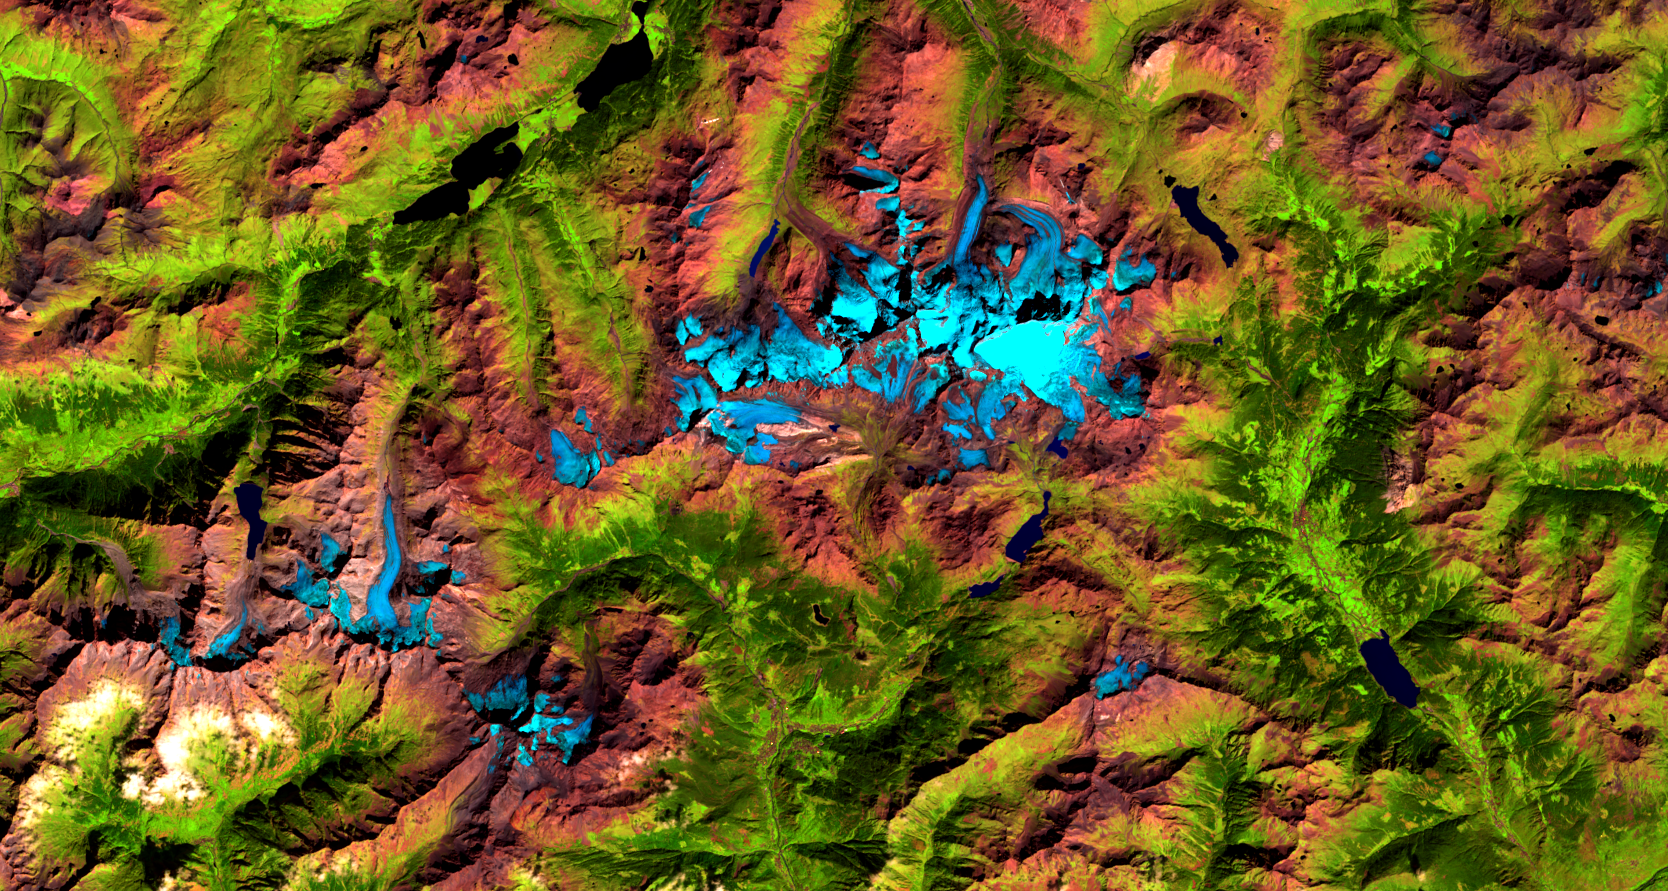
The images above have been generated by the author using Landsat data from the public STAC collection offered by Microsoft. It is a false color composite that highlights snow and ice. The color channels correspondence is red: Landsat Swir16, green: Landsat Nir, Blue: Landsat Red.
They don’t contain only the cited glaciers but a broader area, to give a better general overview. Additionally, the light blue area does not necessarily correspond exactly to the glacier extent, since it can contain seasonal snow as well. The reduction of the ice coverage is anyway evident.
This article is part of the project “PILLOLE D’ACQUA PIANA: seminari itineranti, blog e podcast per una gestione sostenibile delle risorse idriche in Piana Rotaliana” carried out by ECONTROVERTIA APS and supported by Fondazione Caritro (Prot. no. U445.2023/SG.386 of April 23, 2023).

Related articles:
References:
[1] Legambiente. (2023). Al via Carovana dei Ghiacciai 2023. Legambiente. https://www.legambiente.it/comunicati-stampa/al-via-carovana-dei-ghiacciai-2023/
[2] Notarnicola, C. (2022). Overall negative trends for snow cover extent and duration in global mountain regions over 1982–2020. Scientific Reports, 12(1). https://doi.org/10.1038/s41598-022-16743-w
[3] MODIS/Terra Snow Cover Daily L3 Global 500m SIN Grid, Version 61. (2020, October 1). National Snow and Ice Data Center. https://nsidc.org/data/mod10a1/versions/61
[4] Wikipedia contributors. (2023). Landsat program. Wikipedia. https://en.wikipedia.org/wiki/Landsat_program
[5] STAC: SpatioTemporal Asset Catalogs. https://stacspec.org/en
[6] Microsoft Planetary Computer. https://planetarycomputer.microsoft.com/
Cover- and preview image: The Lares Mandrone Glacier in 2000 seen from the Landsat satellite, author.

