Etienne Hoekstra
March 04, 2022

Following the latest IPCC report, Climate Change 2022: Impacts, Adaptation and Vulnerability, 3.3 billion people are highly vulnerable to climate impacts, and half of the world’s population experiences severe water shortages for at least a month per year [1]. In Southern Europe, more than a third of the population will face water shortages if global warming reaches + 2°C [2].
Due to its potential impact, the water crisis constantly ranks in the top five risks to the global economy, according to the World Economic Forum [3]. Understanding our water consumption is crucial to ensure that we have sufficient water to sustain all the world’s living beings.
A research study by the Dutch University of Twente has shown that the indirect water consumption of many households is 50 to 100 times higher than the direct household consumption. An average person uses 5000 liters of water daily, equivalent to 50 bathtubs, but depending on where you live and what you eat, your water usage will range from 1500 to 10000 liters a day [4].
How is all this possible?
Personal water consumption is not limited to direct household water consumption but also the indirect one. The Water Footprint Network (“WFN”) defined the personal water footprint as “the amount of water you use in your daily life, including the water used to grow the food you eat, to produce the energy you use and for all the products in your daily life – your books, music, house, car, furniture and the clothes you wear” [4].
Our diet has the most significant impact on our water footprint. Livestock farming accounts for 20 to 33 % of all freshwater consumption in the world, mainly due to water usage for animal feed. A kilogram of meat requires five to ten kilograms of feed, whereas the production of a hamburger from farm to fork is equivalent to having 35 showers. In terms of feed and water footprint, it would thus be way more efficient to eat the same amount of maize or soy eaten by a cow, by ourselves. Different diets have therefore different water footprints. In the Netherlands, a vegetarian diet (2700 liters per day) uses 40 % less water than a carnivorous diet (4300 liters per day), while a vegan diet saves even more.
Another major consumer of water is coffee because it is grown in tropical fields prone to severe water evaporation. Producing sufficient coffee beans for one cup of coffee requires 140 liters of water which are equivalent to 1000 coffee cups of filtered water. Additionally, water resources in these areas are limited available and cannot be used for other purposes simultaneously.
And what about the clothes we wear? Cotton is the raw material used for most clothing and is significantly water-intensive. According to the world average, the process to make a pair of jeans (cultivation of cotton, dyeing and production) requires about 8000 liters of water. In some parts of the world, the same pair of jeans requires as much as 12,000 liters, indicating considerable differences in effective production processes (e.g., adopting sustainable irrigation methods). It is easy to imagine the enormous impact of fast fashion.

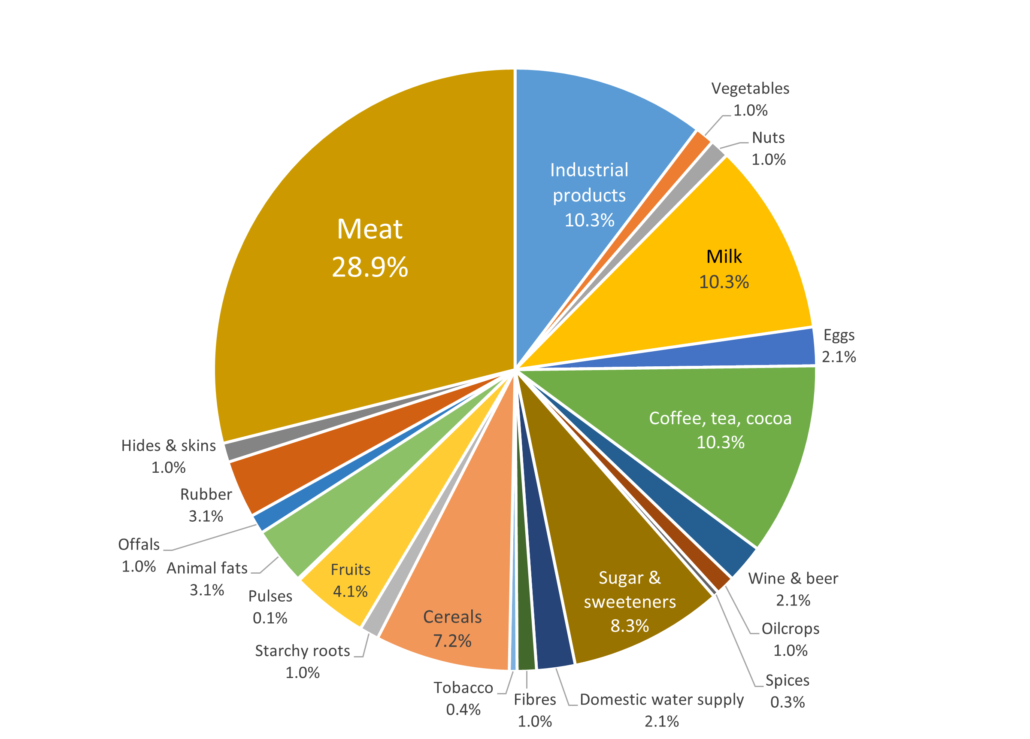
Figure 1: Rough water footprint estimation of a Western European consumer. Source: Mekonnen & Hoekstra – National Water Footprint Accounts, 2011 [5].
While most people – especially in developed regions – live in urban areas, most water is used in farming and, to a lesser extent, in industrial and mining activities of rural areas. Urban people cannot see the water consumption and pollution associated with the goods consumed in their everyday life because water exploiting activities take place far away from cities or are practically hidden from their view. Besides, the cost of water consumption and pollution is not or hardly included in the price of the goods produced, resulting in a lack of awareness and lack of true pricing [6].
People living in rainy regions like the Netherlands may see water scarcity as a distant problem. However, Dutch people are more closely connected to water shortages than they might think. Only a fraction of the Dutch water footprint originates from its territory, leaving 89 % to foreign sources [7].
“A surprising 40 % of the water footprint of European consumers lies outside of the continent, often in places facing severe water problems. Much of our food and many other goods are imported from countries with water-stressed catchments.”
(Hoekstra, 2020, p.VIII)
As the Dutch water footprint is relatively large, it requires a disproportionate amount of water to maintain its lifestyle. The fragmentation of our worldwide water usage can have huge impacts on local water resources. The growing demand for water and the overexploitation of scarce freshwater supplies lead to water scarcity, economic decline and water disputes in many parts of the world [8].
What can we do about it?
Everybody can make a positive impact on their personal water footprint. Awareness is the first step towards change, so a good way to start is to measure your own water footprint using WFN’s personal calculator. Our daily life actions can enhance living conditions and preserve water-dependent plants and animals worldwide [4].
Of course, we cannot do it alone. The water footprint of corporate production processes also plays an important role. Yet, relevant information in this field is entirely lacking [6]. As companies increasingly focus on their indirect supply chain (scope 3) emissions, it is time that they start disclosing their water footprint. Such disclosure would allow consumers to buy water-friendly products and encourage responsible water usage.
Let’s work together towards a fair and efficient use of freshwater resources worldwide!
Bibliography:
[1] IPCC. (2022). Technical Summary IPCC WGII Sixth Assessment Report (FINAL DRAFT). Downloaded 1 March 2022, from https://report.ipcc.ch/ar6wg2/pdf/IPCC_AR6_WGII_FinalDraft_TechnicalSummary.pdf
[2] IPCC. (2021). Fact sheet – Europe. Downloaded 1 March 2022, from https://report.ipcc.ch/ar6wg2/pdf/IPCC_AR6_WGII_FactSheet_Europe.pdf
[3] World Economic Forum. (2021). The Global Risk Report 2021. Downloaded 1 March 2022, from https://www3.weforum.org/docs/WEF_The_Global_Risks_Report_2021.pdf
[4] The Water Footprint Network. (n.d.). Personal water footprint. Retrieved 1 March 2022, from https://waterfootprint.org/en/water-footprint/personal-water-footprint/
[5] Mekonnen, M. M., & Hoekstra, A. Y. (2011). National water footprint accounts: The green, blue and grey water footprint of production and consumption. Volume 1: Main Report. Downloaded 1 March 2022, from https://digitalcommons.unl.edu/cgi/viewcontent.cgi?article=1077&context=wffdocs
[6] Hoekstra, A. Y. (2020). The Water Footprint of Modern Consumer Society (2nd edition) London: Routledge. https://doi.org/10.4324/9780429424557
[7] Van Oel, P. R., Mekonnen, M. M., & Hoekstra, A. Y. (2008). The external water footprint of the Netherlands. Downloaded 1 March 2022, from https://www.waterfootprint.org/media/downloads/Report33-ExternalWaterFootprintNetherlands.pdf
[8] Hogeboom, R. J., De Bruin, D., Schyns, J. F., Krol, M. S., & Hoekstra, A. Y. (2020). Capping human water footprints in the world’s river basins. Earth’s Future, 8(2). https://doi.org/10.1029/2019EF001363.
Cover- and preview image: globe in a waterdrop. Free-source photo by TeGy on Pixabay.


